Pay-Gap Risk Scoring
built for due diligence
ParityScore analyzes compensation data to produce a clear 0 – 100 score, highlight red-flags, and monitor people-related risks...
-
Deal clarity: Quantify hidden people risks that impact valuation.
-
Red-flag list: Pinpoint departmental gaps, confidence bands, drivers of pay gaps.
-
Future-proofing: Align with upcoming pay transparency rules in the EU and investor's ESG expectations.
-
Comparable metric: Track a KPI across targets or progress within a company.
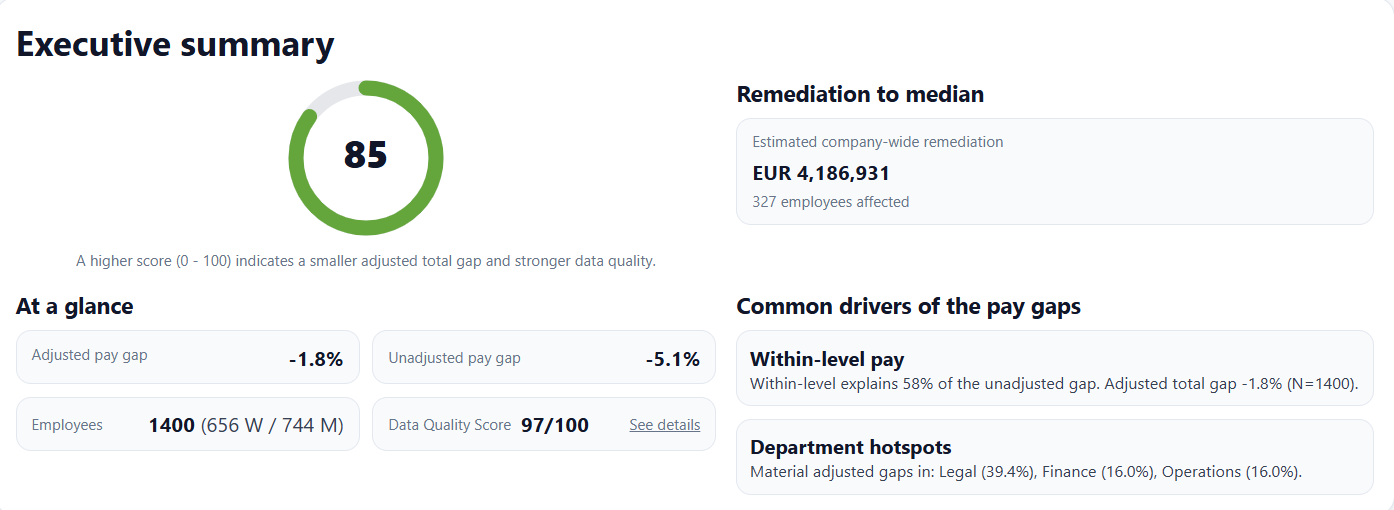
ParityScore
85
Adjusted pay gap
-1.6%
Unadjusted pay gap
-5.1%
Redemiation cost
€4.2m
Example metrics shown for illustration.
Why the pay gap matters
Gender-related compensation disparities aren’t just a social issue. They affect price, integration, and long-term performance. Companies that ignore pay-equity risk can face unexpected liabilities, struggle with talent, and incur reputational damage.
Valuation impact
Back-pay claims, and salary corrections can quickly add up. A KPI on pay gaps helps price these risks rather than absorbing them post-close.[1]
20-35% of all employees may claim remediation
"Remediating pay gaps in mid-sized companies often involves one-off adjustments in the “low-to-mid single digit millions.”[1]
People & integration
Inequities can trigger churn among top talent, fuel distrust during integration, and complicate harmonization of pay bands.
HR due diligence regularly finds pay-equity gaps, as a red-flag for integration risk.[2][3]
“Retention risk was underestimated and within 12 months of close we lost 40% of senior women in tech roles post-acquisition.”
~ HR Director, mid-cap private equity company
Governance & reporting
Regulators and investors expect clarity on “S” risks. Pay transparency laws in the EU and US mean boards need defensible numbers, not anecdotes.
The upcoming EU Pay Transparency Directive (in force June 07, 2026) will mandate disclosures that buyers must anticipate today.[4]
Sources (click to expand)
- PricewaterhouseCoopers (Dec 2024) — Transparency Report 2023/2024. Report.
- Harvard Law School Forum on Corporate Governance (Jan 12, 2023) — Prioritizing Human Capital: Modern Challenges and the Board’s Role. Article.
- U.S. SEC Investor Advisory Committee (Sep 14, 2023) — Recommendation Regarding Human Capital Management Disclosure. Guidance.
- EUR-Lex — Directive (EU) 2023/970 (May 17, 2023), Article 34 (transposition by June 07, 2026). EU Directive ·
- Governance Professionals of Canada & RR Donnelley (2021) — Institutional Investor Survey 2021. Report.
- Georgeson & Harvard Law School Forum on Corporate Governance (Mar 17, 2025) — Global Institutional Investor Survey 2024 Report. Article.
How it works
From setup to actionable insight in four steps.
1
Prefill Excel template
Populate gender, department, base salary, bonuses, FTE and job grade.
2
Set parameters
Select the parameters that shall be analyzed by ParityScore in detail.
3
Define peer groups
Define the grading and experience brackets for remediation.
4
Generate report
Run the analysis and receive your Scorecard (0–100).
View sample report
Sample uses public, synthetic data.
Pricing
Annual license with unlimited analyses and entities; priced by max employees per dataset.
Small
≤ 250 employees
€1,000/year
Most popular
Growth
≤ 1,000 employees
€1,750/year
Mid-Market
≤ 2,500 employees
€3,000/year
Enterprise (2,501+) · Pricing upon demand
FAQs
Questions frequently asked before piloting.
ParityScore
Methodology
Data Security
Ready to pilot ParityScore?
Share a few details and we’ll follow up with next steps.